
Cyclical Analysis : This report presents a statistical analysis of seasonal (or annual) trends in the S&P 500 Index, focusing on historical patterns to evaluate potential movements in the coming months.
By Eugenio Sartorelli – www.investimentivicenti.it
Copyright DMF New Media – ETFWorld.co.uk
Reproduction prohibited in any form, even partial
Based on 50 years of data, we compare the annual performance (from the first trading day of January to the last day of the year) to identify consistencies (or inconsistencies) with the current year’s trajectory up to April 2025.
Let’s take a quick look at the S&P500 Index (daily data as of 17 April 2025):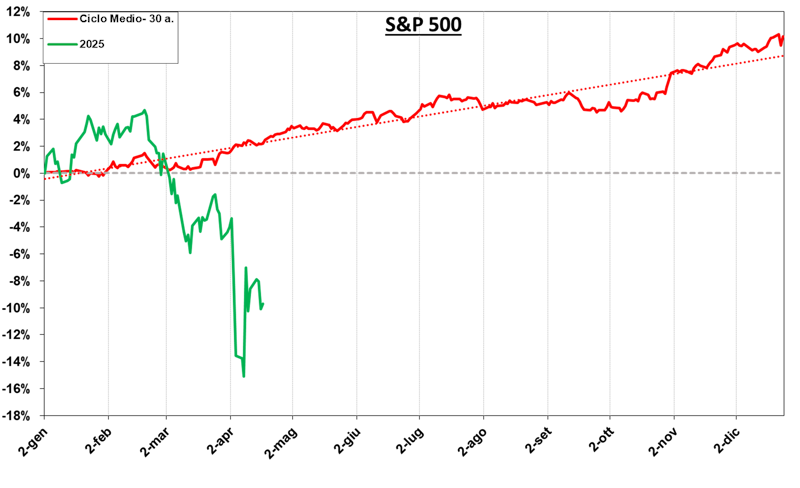 The red line represents the 30-year historical average annual performance, expressed as a percentage relative to the first data point of each year. The green line shows the 2025 performance (as a percentage relative to the first data point of the year).
Currently, there is an inverse correlation: the 2025 trend (green line) initially rose but then declined to a recent low on April 8 (green arrow). In contrast, the 30-year average (red line) shows a stable phase until mid-March (red arrow), followed by a clear upward trend, particularly from April to early July and again from October to year-end. This bullish momentum in April, May, and June is partly linked to the dividend season during these months.
The current correlation between the two trends is -72%. A reduction in this negative correlation could signal a recovery phase for the S&P 500, continuing the rebound observed since the April 8 low.
Let us now look at the statistics of each month’s % trends: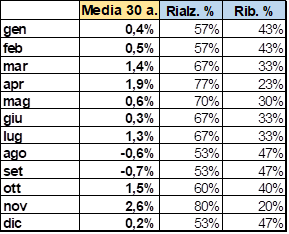
April historically shows an average gain of 1.9% over the past 30 years. Notably, 77% of past Aprils closed positive, highlighting that the current 2025 trend is significantly outside historical norms.
In summary, April is typically one of the strongest months, and a return to historical averages could imply further recovery in the short term.
Lastly, we also see the past vintages most correlated with the current 2025 vintage: The four most correlated historical years with 2025 all show correlations above 75%.
In these past years, April and May consistently marked recovery phases (varying in intensity). This further supports the potential for a rebound to align with historical trends.
Copyright DMF New Media – ETFWorld.co.uk
Reproduction prohibited in any form, even partial
Disclaimer
The contents of these notes and the opinions expressed should in no way be regarded as an invitation to invest. The analyses do not constitute a solicitation to buy or sell any financial instrument.The purpose of these notes is financial analysis and investment research. Where recommendations are made, they are of a general nature, are addressed to an indistinct audience and lack the element of personalisation. Although the result of extensive analysis, the information contained in these notes may contain errors. Under no circumstances can the authors be held liable for any choices made by readers on the basis of such erroneous information.erroneous information. Anyone deciding to carry out any financial transaction on the basis of the information contained in the site does so assuming full responsibility.
Subscribe to Our Newsletter