
Cyclical Analysis: Let’s examine what certain indicators derived from the Implied Volatility and Options markets can tell us about the world’s primary market – the United States.
By Eugenio Sartorelli – www.investimentivicenti.it
Copyright DMF New Media – ETFWorld.co.uk
Reproduction prohibited in any form, even partial
We begin with the classic Implied Volatility Index, the VIX (daily data from January 2024 through the afternoon of May 30th):
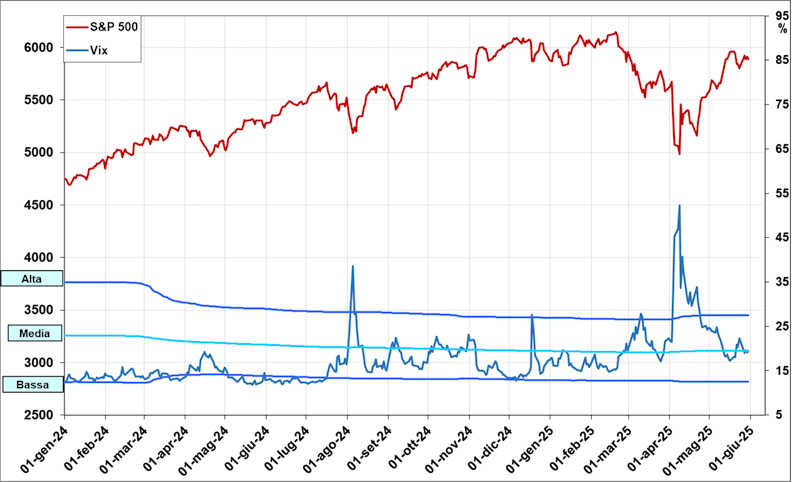
This indicator exhibits the classic contrarian relationship to the S&P 500 Index, particularly forming very pronounced peaks corresponding to market lows, as clearly evident in the chart; hence its nickname, the “fear gauge.”
Recently, the VIX reached a significant peak high on April 8th (see blue arrow) with values near 52 points – levels unseen since March 2020. Simultaneously, the S&P 500 Index formed a pronounced low (see red arrow) around 4980 points. We know the trigger for this turbulence was the issue of threatened US tariffs. Subsequently, the VIX declined to a low by May 16th (see green arrow), reaching values around 17 points. This coincided with the S&P 500’s recovery up to the present. However, the VIX is now showing signs of nervousness, hovering around its historical average. This appears to signal that the S&P 500 is experiencing exhaustion in its strength rebound.
Let’s also examine another sentiment indicator linked to Volatility: the VVIX chart (daily data):
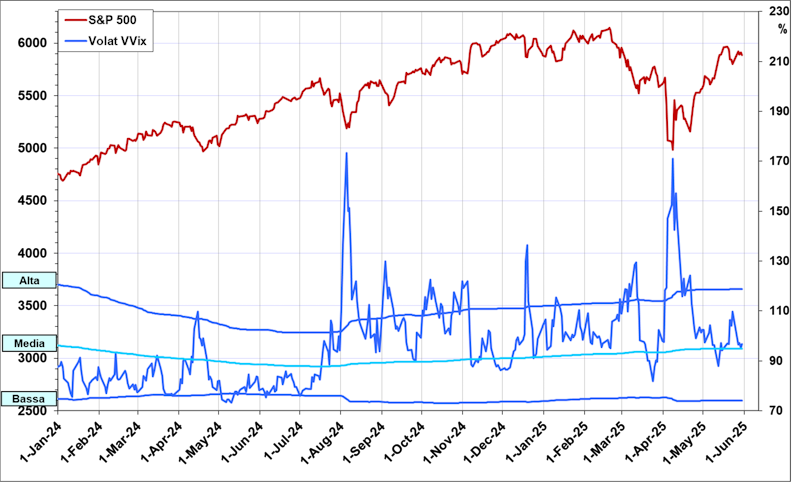
The VVIX Index relates to the Volatility of the VIX Index itself, which can be traded via futures and options. The VVIX Index shares similar characteristics with the VIX but can act as an amplifier of Volatility and sometimes a leading indicator.
Here too, the VVIX reached a significant peak on April 8th (see blue arrow), coinciding with the S&P 500 low. Subsequently, the VVIX declined until around May 12th and has since returned to levels near its historical average. The VVIX also suggests the S&P 500 is probing a potential top formation area.
Finally, let’s look at the VVIX/VIX ratio:
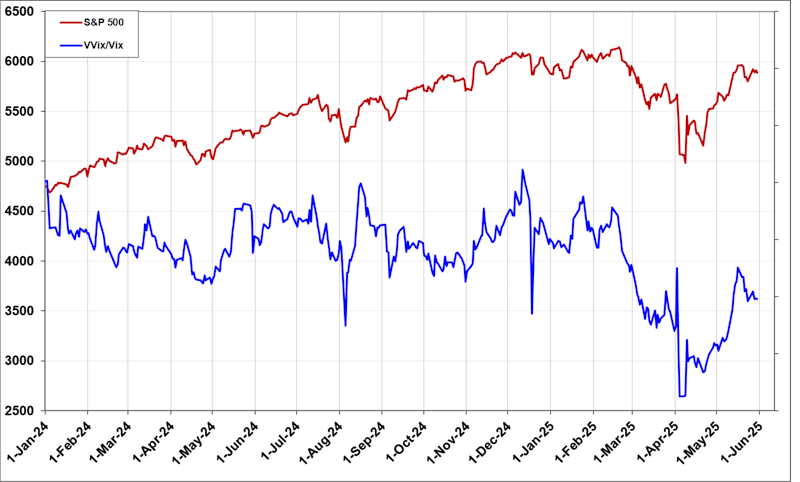
Without delving into excessive detail on this indicator, it often confirms or contradicts potential turning points. Significantly, on May 16th (see blue arrow), this indicator reached a peak high, suggesting a potential topping area for the S&P 500.
Copyright DMF New Media – ETFWorld.co.uk
Reproduction prohibited in any form, even partial
Disclaimer
The contents of these notes and the opinions expressed should in no way be regarded as an invitation to invest. The analyses do not constitute a solicitation to buy or sell any financial instrument.The purpose of these notes is financial analysis and investment research. Where recommendations are made, they are of a general nature, are addressed to an indistinct audience and lack the element of personalisation. Although the result of extensive analysis, the information contained in these notes may contain errors. Under no circumstances can the authors be held liable for any choices made by readers on the basis of such erroneous information.erroneous information. Anyone deciding to carry out any financial transaction on the basis of the information contained in the site does so assuming full responsibility.
Subscribe to Our Newsletter