Sartorelli Eugenio Investimentivicenti

Cyclical Analysis: Relationship Between US Bonds and Stocks and the Current Phase

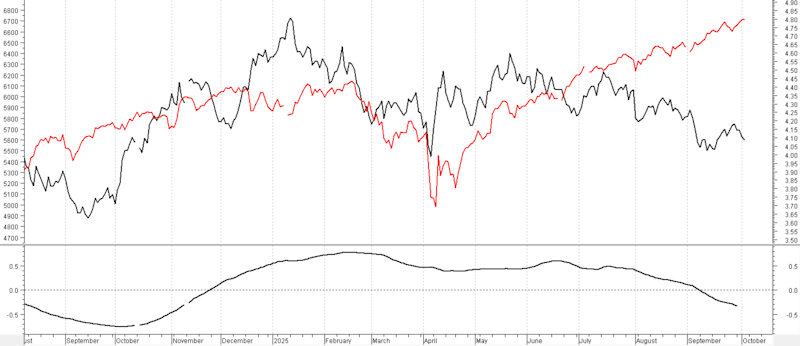
Cyclical Analysis: This article attempts to examine the current relationships between Bond yields (specifically the T-Note, i.e., the 10-year US Treasury note) and the S&P500 index.


Reproduction prohibited in any form, even partial


The classic intermarket relationship states that Bond yields (which we know move inversely to their prices) should more often than not have an inverse relationship with stock index values. The reasoning is that high Bond prices are linked to relatively low yields; these low yields lead portfolio managers to look at stocks with greater interest, precisely because they consider bond yields less attractive. Conversely, when bond yields are high (and therefore bond prices are low), this asset class is viewed with greater interest compared to stocks.

In reality, things are more complicated, and other parameters such as inflation, Central Bank policies, and expectations regarding the economic cycle should be evaluated.

We will focus primarily on the relationship between the T-Note yield and the performance of the S&P500 starting from April 2024, using daily data up to October 3rd.

The black line represents the T-Note yield (right scale), the red line represents the value of the S&P500 Index (left scale). At the bottom is the correlation between the two charts, calculated on 126 data points (i.e., 6 months of data).

As can be seen, this correlation was persistently positive from December 2024 until early September 2025 (see green arrows); this is in contrast to the more frequent rule. From there, a negative correlation began.

Looking at the two charts in more detail, the opposite trend is more evident from the peak in the T-Note yield on April 21, 2025 (see blue arrow) when it was yielding approximately 4.6%.

Therefore, it is from that date that the negative correlation between the two charts resumed working, according to the classic rule mentioned at the beginning. The previous positive and prolonged correlation between the two charts seems more like an anomaly.

We know that the Fed has forecast two additional potential interest rate cuts from now until the end of the year. This could push the yield of the T-Note and Dollar-area Bonds in general even lower. This should, on average, support the prices of US stock indices.

However, it is difficult to imagine that the S&P500 can continue to rise from now until the end of the year without at least a partial correction, with the correlation with the T-Note potentially only momentarily turning positive again.


Reproduction prohibited in any form, even partial

Disclaimer

The contents of these notes and the opinions expressed should in no way be regarded as an invitation to invest. The analyses do not constitute a solicitation to buy or sell any financial instrument.The purpose of these notes is financial analysis and investment research. Where recommendations are made, they are of a general nature, are addressed to an indistinct audience and lack the element of personalisation. Although the result of extensive analysis, the information contained in these notes may contain errors. Under no circumstances can the authors be held liable for any choices made by readers on the basis of such erroneous information.erroneous information. Anyone deciding to carry out any financial transaction on the basis of the information contained in the site does so assuming full responsibility.


Subscribe to Our Newsletter
I have read the Privacy policyand I authorize the processing of my personal data for the purposes indicated therein.

Newsletter ETFWorld.co.uk

I have read the Privacy policyand I authorize the processing of my personal data for the purposes indicated therein.