According to the principles of intermarket analysis, bond yields (which move in the opposite direction to prices) usually show an inverse correlation with the equity markets.
The dynamic is linear: when rates are low, managers tend to favour equities, as the returns offered by the fixed income sector are unattractive. Conversely, when government bond yields rise significantly, the bond asset class regains competitiveness, prompting investors to shift capital from equities to the safety of fixed income.
In reality, things are more complicated and other parameters such as inflation, central bank policies and economic cycle expectations should also be taken into account.
We will focus mainly on the relationship between T-Note yields and the performance of the S&P 500 since April 2024, using daily data.

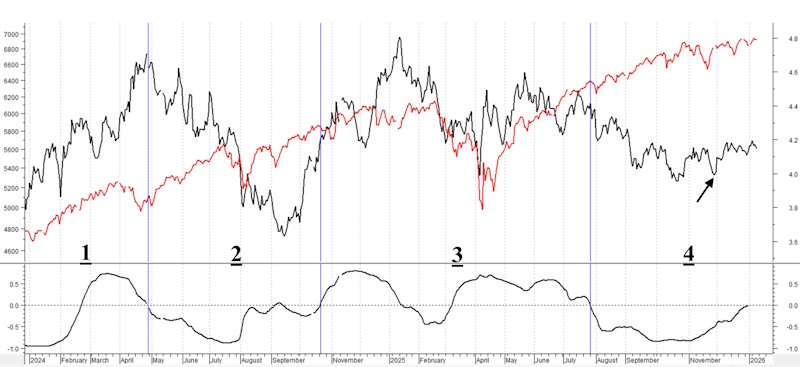
The black line represents T-Note yields (right scale), while the red line represents the value of the S&P 500 Index (left scale). At the bottom is the correlation between the two graphs, calculated on 63 data points (i.e. three months of data). As can be seen, this correlation has been consistently positive since January 2024.
I have highlighted three distinct phases in which there were different levels of correlation:
- until the end of April 2024, when T-Note yields and the S&P 500 rose on average; correlation turned positive;
- until the end of October 2024, with T-Note yields falling and the S&P 500 rising; correlation was negative on average;
- until the end of July 2025, with different trends in the two markets, but similar in nature; correlation was positive on average;
- to date, with T-Note yields falling and then moving sideways and the S&P 500 rising; correlation was negative.
In reality, since the low on 27 November (see black arrow), T-Note yields have been rising slightly, with the S&P 500 also rising. This has caused the correlation to increase and is now close to a positive value.
We know that the Fed has lowered the US interest rate three times, most recently in December. However, since the end of November, the T-Note yield has been rising, albeit slightly. Some macro analysts predict that US inflation will not fall and may even rise slightly in 2026. In reality, expectations are still for around two US rate cuts in 2026. This could lead to a further decline in US bond yields. This would be more favourable to maintaining the bullish momentum for US equities. Therefore, the correlation, which, as can be seen from the chart, seems to be returning to positive territory, will instead return to the more “natural” negative area.
Especially with the change of Fed Chair at the end of May and a new Chair who is more accommodating towards the US administration, an accommodative policy is expected, which could keep bond yields low to medium and equities at high levels.