
Cyclical Analysis on Bitcoin : Bitcoin and traditional markets – a closer link than expected. Eugenio Sartorelli, through a cyclical analysis based on weekly data, reveals how Bitcoin shares significant trends with the S&P 500 and the Nasdaq 100, despite heightened volatility.
By Eugenio Sartorelli – www.investimentivicenti.it
Copyright DMF New Media – ETFWorld.co.uk
Reproduction prohibited in any form, even partial
Let’s start with the following chart that I often show in various of my talks at Cryptocurrency conferences:
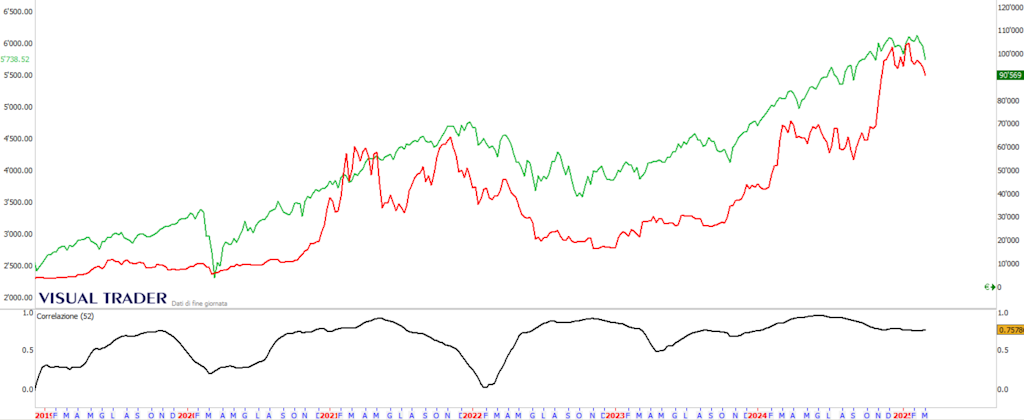
In red the Bitcoin; in green the S&P500 Index with weekly data as of late 2018. Only with Weekly data can valid comparisons be made, since using daily data there is the problem of Saturday and Sunday when Bitcoin has a quote while the regulated markets are closed.
Below the black line represents the 1-year Correlation Coefficient based on prices. I do not use the classical correlation based on returns, as we can see the similarities of price trends better this way.
We know that a positive correlation over 0.5 is significant of the similarity between 2 financial charts. Well, we can see from this graph that the correlation between the 2 graphs has been above 0.5 for the majority of the time. More recently it is may (see arrow in figure) that the correlation is quite high.
Probably the flow of money into the 2 markets has followed similar paths; in practice the risk-on and risk-off phases, related to risk appetite on the part of traders, are similar in the 2 markets. I could also show a similar graph with Bitcoin and Nasdaq100 and get similar results.
Clearly the Bitcoin movements have a higher intensity, related to the higher volatility, but the similar trends are quite obvious.
Now let us go slightly more in detail and look at potential cyclical phases, assuming that an Intermediate Cycle exists here as well (average duration of about 3 calendar months, with an erratic range of at least 25%). For classical financial markets there is good empirical evidence of such cycles, which I recall cannot be of constant duration and are not always evident. For Bitcoin there is not enough data to confirm these hypotheses; however, the clear correlation with the S&P500 and more in-depth studies I have personally conducted tell us that there are cyclical patterns for this market.
Let us now look at the cyclical analysis on Bitcoin to outline possible developments (daily data as of the end of July 2024):
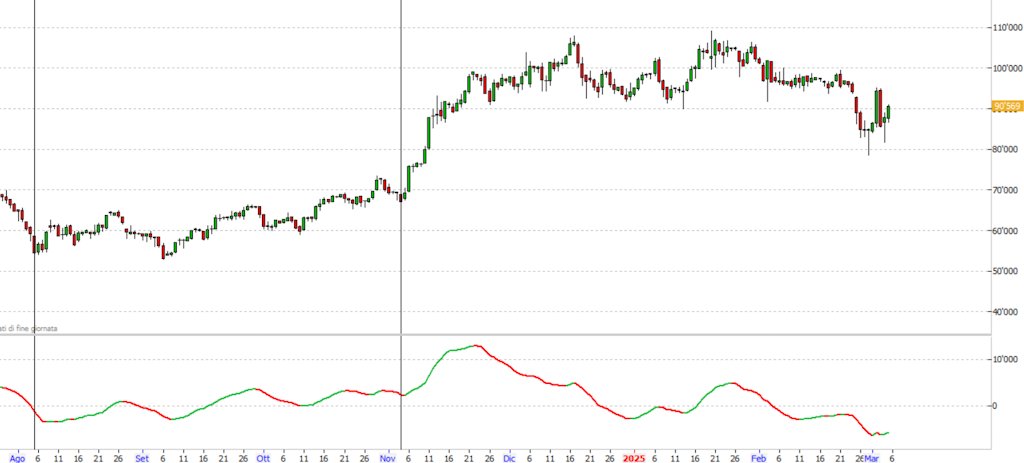
The Oscillator below (a classic Price Oscillator appropriately sized) attempts to highlight the cyclical forces of the Intermediate Cycle. Current cyclical structures on the S&P500 and analogies with Bitcoin will also be taken into account in our considerations.
We start from the important low of August 5, 2024 (see leftmost vertical line) from which there has been a mild bullish cyclical development.
From November 4, 2024 (see vertical line in the middle) there was a definite bullish impulse, with the start of a new cyclical phase, until the high of November 17, with values rising from about $67000 to $108000. Thereafter there were alternating phases with substantial laterality and prices always above $ support. Since February 25 there has been a decline below this support with a low even below $80000 on February 28 (see blue arrow). Notice how the cyclical indicator below has proceeded with a steady descent.
This is a rather critical phase as we are at a crossroads.
The February 28 low could be the end of a cyclical structure and therefore there could be a recovery of strength with values moving back toward $100000. The other possibility is that of a different cyclical structure, with potential further weakness occurring by March. In that sense we could return to testing $80000 and there would also be time for possible descents toward $75000 and up to $70000. Only after finding a deeper low could there be a recovery phase. For now I assign to this second scenario some more potential.
I remember that although there are cyclical structures within the financial markets, these are not and cannot be exactly regular. Therefore, the analysis carried out can only be probabilistic, within a set of rules that Cyclical Analysis provides.
Copyright DMF New Media – ETFWorld.co.uk
Reproduction prohibited in any form, even partial
Disclaimer
The contents of these notes and the opinions expressed should in no way be regarded as an invitation to invest. The analyses do not constitute a solicitation to buy or sell any financial instrument.The purpose of these notes is financial analysis and investment research. Where recommendations are made, they are of a general nature, are addressed to an indistinct audience and lack the element of personalisation. Although the result of extensive analysis, the information contained in these notes may contain errors. Under no circumstances can the authors be held liable for any choices made by readers on the basis of such erroneous information.erroneous information. Anyone deciding to carry out any financial transaction on the basis of the information contained in the site does so assuming full responsibility.
Subscribe to Our Newsletter