
Cyclical Analysis : In this article, we aim to examine the current relationship between bond yields (specifically the T-Note, the 10-year U.S. Treasury bond) and the S&P 500 index.
By Eugenio Sartorelli – www.investimentivicenti.it
Copyright DMF New Media – ETFWorld.co.uk
Reproduction prohibited in any form, even partial
Classical intermarket theory suggests that bond yields (which are inversely related to bond prices) typically exhibit an inverse relationship with equity indices. The rationale is that high bond prices correspond to lower yields, leading portfolio managers to favor equities due to unattractive bond returns. Conversely, when bond yields are high (and prices low), fixed income becomes more appealing relative to equities.
In reality, the dynamics are more complex and require consideration of additional factors such as inflation , central bank policies, and economic cycle expectations.
We will focus on the relationship between the T-Note yield and the S&P 500 from 2024 onward, using daily data.
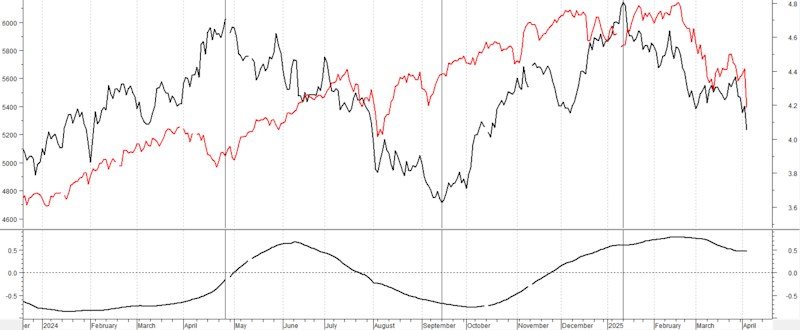
- The black line represents the T-Note yield (right scale).
- The red line represents the S&P 500 index value (left scale).
- The bottom chart shows the correlation between the two, calculated over 126 data points (6 months).
Four phases of the T-Note yield trend :
- First rising phase until the peak in late April 2024 (green arrow).
- Subsequent decline until mid-September 2024 (black arrow), linked to potential Fed rate cuts and controlled inflation.
- New rising phase until the January 13 peak (gray arrow), driven by expectations of inflationary pressures due to the new U.S. administration’s policies.
- Current declining phase , still ongoing, with motivations yet to be clarified.
During these four phases, the S&P 500 experienced near-constant growth until its recent peak on February 19 (red arrow). The correlation chart below confirms the lack of a consistent relationship between the two markets, as also evident from the graphs. While the “natural” correlation is expected to be inverse, since the September 2024 yield low, a direct correlation has emerged: the T-Note yield and S&P 500 are both declining.
This situation likely reflects a “confused” or highly uncertain environment among investors, particularly in 2025, due to the new U.S. administration’s shifting trade policy statements and their potential economic and financial repercussions.
The current decline in bond yields is partly due to an overweight in bonds and a reduction in equity exposure. This suggests the U.S. administration may aim to lower government bond yields to reduce public debt costs. Meanwhile, the equity market is under pressure, likely due to concerns over the economic impact of U.S. tariff policies, signaling a broader slowdown. Both markets appear to be searching for a support level to halt the downturn.
Copyright DMF New Media – ETFWorld.co.uk
Reproduction prohibited in any form, even partial
Disclaimer
The contents of these notes and the opinions expressed should in no way be regarded as an invitation to invest. The analyses do not constitute a solicitation to buy or sell any financial instrument.The purpose of these notes is financial analysis and investment research. Where recommendations are made, they are of a general nature, are addressed to an indistinct audience and lack the element of personalisation. Although the result of extensive analysis, the information contained in these notes may contain errors. Under no circumstances can the authors be held liable for any choices made by readers on the basis of such erroneous information.erroneous information. Anyone deciding to carry out any financial transaction on the basis of the information contained in the site does so assuming full responsibility.
Subscribe to Our Newsletter