
Cyclical Analysis : In this article, we aim to explore the current relationship between the performance of the S&P 500 index and the price of gold.
By Eugenio Sartorelli – www.investimentivicenti.it
Copyright DMF New Media – ETFWorld.co.uk
Reproduction prohibited in any form, even partial
The classic intermarket relationship states that the stock market tends to peak before the economic cycle’s zenith, while commodities—particularly gold—typically peak after the economic cycle’s high. This temporal gap between the two markets is mediated by inflation trends and the policies of central banks, especially the Federal Reserve (Fed). It is not possible to define a fixed correlation between these two markets; instead, their relationship must be analyzed case by case within the prevailing economic context.
Below, we examine the chart showing the performance of the S&P 500 and gold since 2024, using daily data.
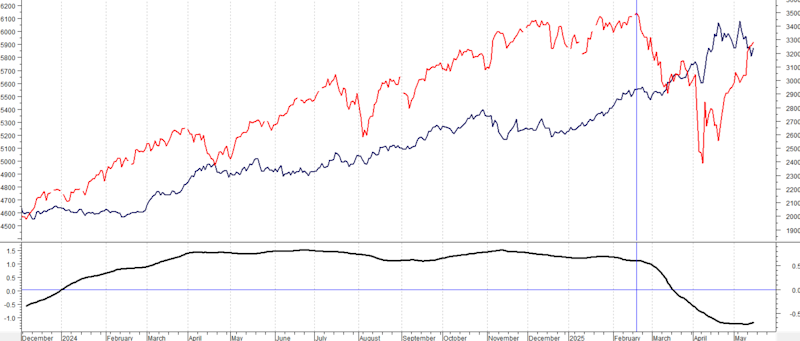
The blue line represents the gold price (right scale), while the red line shows the S&P 500 index (left scale). The bottom section displays the correlation between the two, calculated using 126 data points (i.e., 6 months of data).
As evident, from early 2024 until February 2025 (vertical line), the correlation between the two was strongly positive, with values above +0.5. In the subsequent phase, the correlation declined and is now sharply negative. During this period, the S&P 500 marked a significant low on April 8 (red arrow), while gold demonstrated strength with a double all-time high on April 22 and May 7 (green arrow), reaching prices around $3,500. Currently, gold is undergoing a slight correction, while the S&P 500 continues to recover momentum.
The key takeaway is that, in terms of economic and financial cycles, the U.S. economic cycle may have peaked between the S&P 500’s February high and gold’s May high. Upcoming economic data will confirm or refute this hypothesis.
From a trend perspective, the negative correlation between the two markets is likely to persist in the coming weeks. The S&P 500 could approach its previous highs, while gold may correct further, potentially retracing to at least $3,000.
Copyright DMF New Media – ETFWorld.co.uk
Reproduction prohibited in any form, even partial
Disclaimer
The contents of these notes and the opinions expressed should in no way be regarded as an invitation to invest. The analyses do not constitute a solicitation to buy or sell any financial instrument.The purpose of these notes is financial analysis and investment research. Where recommendations are made, they are of a general nature, are addressed to an indistinct audience and lack the element of personalisation. Although the result of extensive analysis, the information contained in these notes may contain errors. Under no circumstances can the authors be held liable for any choices made by readers on the basis of such erroneous information.erroneous information. Anyone deciding to carry out any financial transaction on the basis of the information contained in the site does so assuming full responsibility.
Subscribe to Our Newsletter