
Cyclical Analysis : Let’s analyze what indicators derived from the Implied Volatility market can tell us about the world’s primary market, the United States.
By Eugenio Sartorelli – www.investimentivicenti.it
Copyright DMF New Media – ETFWorld.co.uk
Reproduction prohibited in any form, even partial
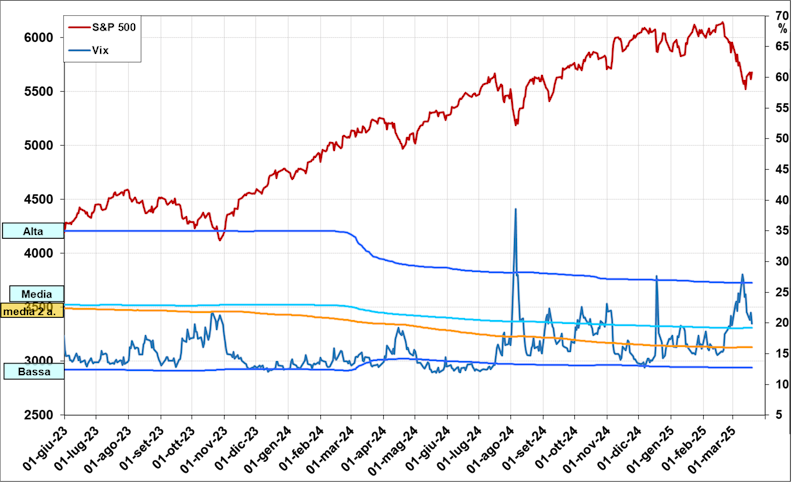
We start with the classic Implied Volatility Index , the VIX (daily data from June 2023 to the close of March 19):
We start with the classic Implied Volatility Index , the VIX (daily data from June 2023 to the close of March 19):
This indicator has a classic contrarian trend compared to the S&P500 Index and, more importantly, peaks sharply at market lows, as clearly shown in the chart. For this reason, it is also called the “fear index.”
Recently, the VIX reached a peak of nearly 28 points on March 11 (see blue arrow), historically high levels. Simultaneously, the S&P500 Index hit a clear low on March 13 (see red arrow). Currently, the VIX is declining but remains above the psychological threshold of 20 points , where the long-term average lies. This signals lingering “fear” linked to the S&P500 correction from its February 19 high (see green arrow), which resulted in an 8.5% decline.
If we interpret these U.S. market concerns, the primary suspect is the new Trump administration’s tariff policy, whose scope remains unclear due to contradictory statements.
This fear did not affect Europe, where major equity indices experienced only a mild correction and have already rebounded in recent days. However, an anomaly persists in Europe, which I will illustrate:
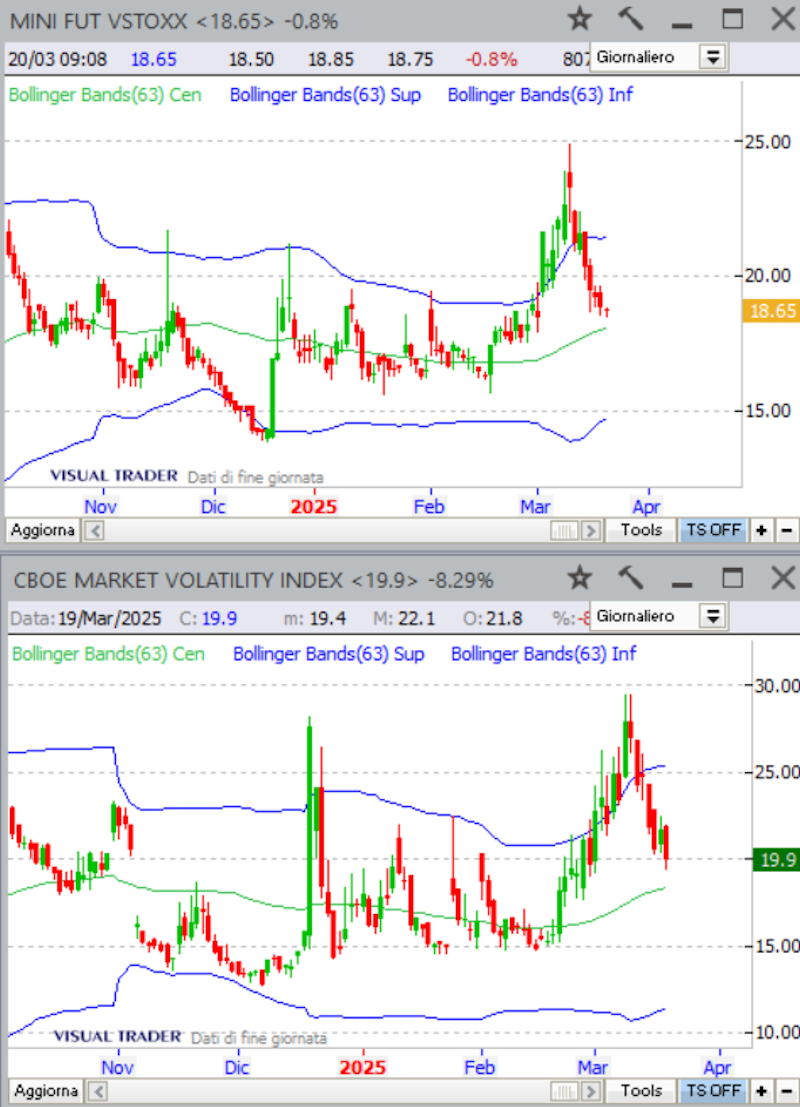
The top graph shows daily data for the VSTOXX (Europe’s “fear index,” tied to the Eurostoxx50 Index), while the bottom graph shows the analogous VIX. Both include 3-month Bollinger Bands.
The two graphs show striking similarities, with both peaking sharply on March 11 (blue arrows) above the upper band, followed by a decline that still keeps values above the 3-month average.
In practice, Implied Volatility confirms that the divergence between European and U.S. equity price trends is a clear anomaly, likely to correct in the coming weeks.
Copyright DMF New Media – ETFWorld.co.uk
Reproduction prohibited in any form, even partial
Disclaimer
The contents of these notes and the opinions expressed should in no way be regarded as an invitation to invest. The analyses do not constitute a solicitation to buy or sell any financial instrument.The purpose of these notes is financial analysis and investment research. Where recommendations are made, they are of a general nature, are addressed to an indistinct audience and lack the element of personalisation. Although the result of extensive analysis, the information contained in these notes may contain errors. Under no circumstances can the authors be held liable for any choices made by readers on the basis of such erroneous information.erroneous information. Anyone deciding to carry out any financial transaction on the basis of the information contained in the site does so assuming full responsibility.
Subscribe to Our Newsletter