The technical situation of the Nifty 50 index (India’s benchmark stock market) appears constructive.
Copyright DMF New Media – ETFWorld.co.uk
Reproduction prohibited in any form, even partial
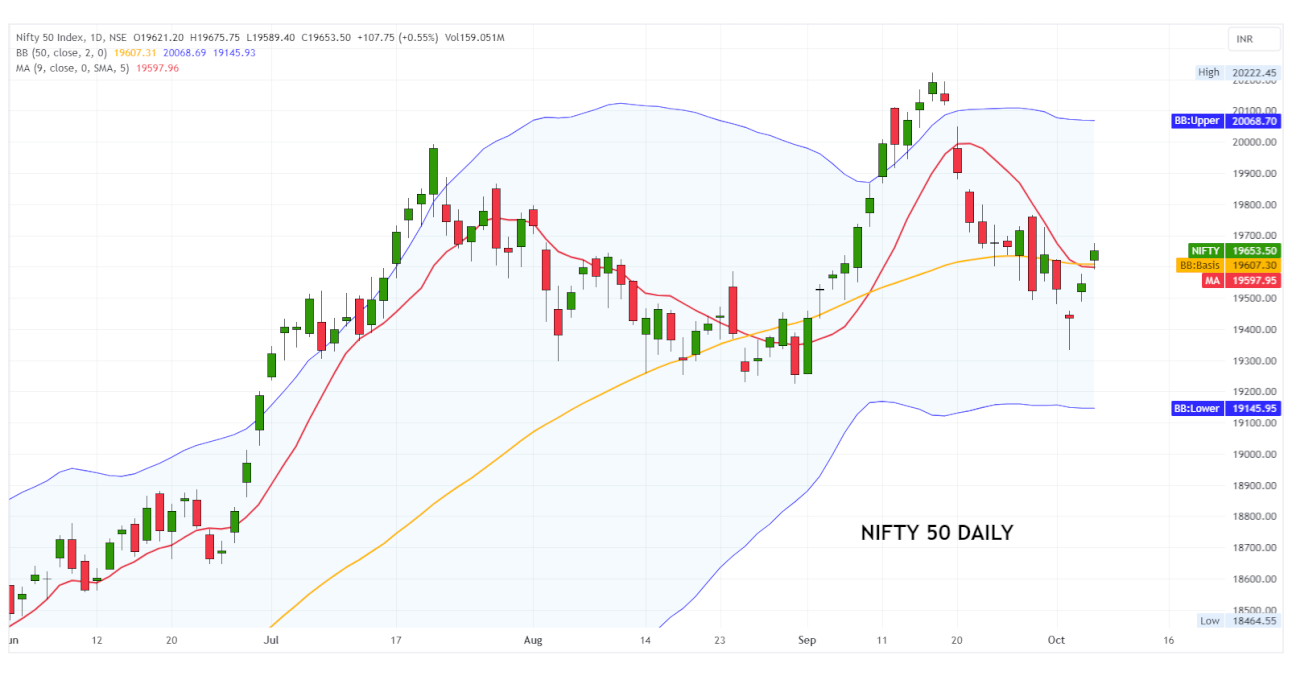
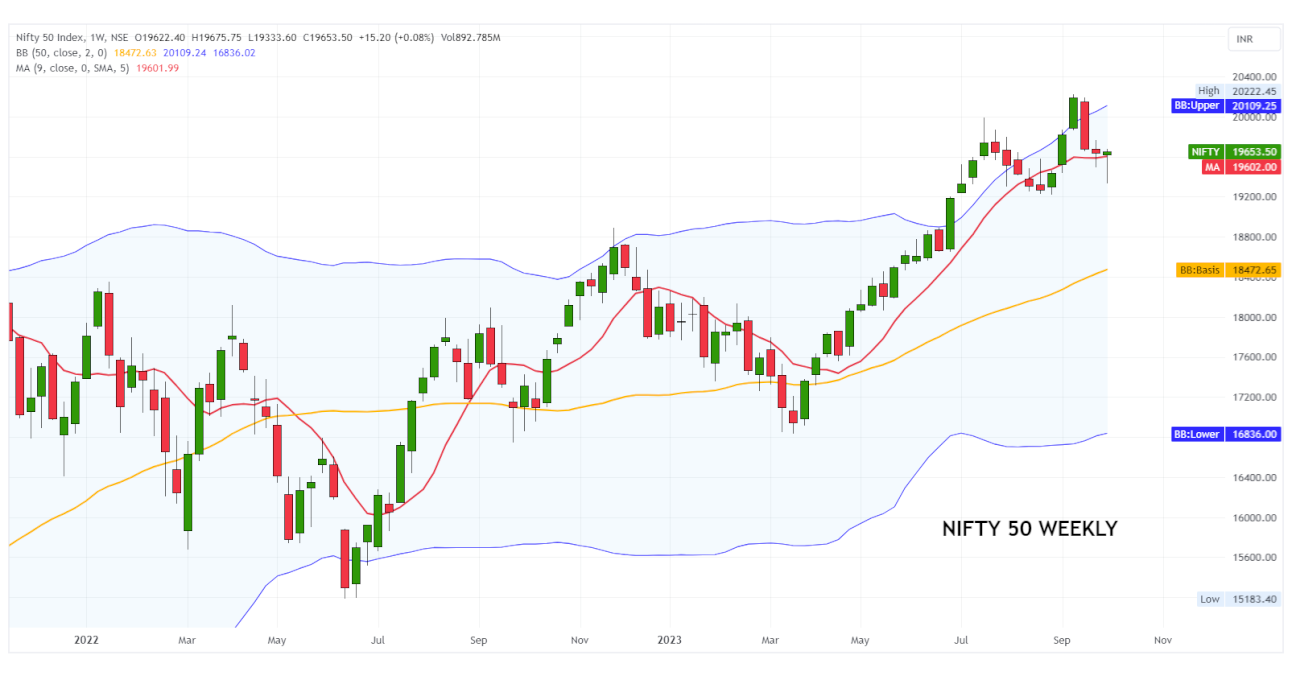
Prices, after having fallen towards the end of March towards 16,850 points, have in fact made a solid bullish movement and have risen above 20,200.
The primary trend is positive, although a lateral consolidation phase above the graphic support placed at 19,250-19,200 points will be necessary before a further leap forward can be made.
In fact, the holding of this area may favour a re-accumulative phase and create the premises for a new bullish spurt.
From a graphical point of view, however, only the breakout of 20,200 points could provide a new demonstration of strength and push prices first towards the 20,600-20,650 area and then towards the psychological threshold of 21,000 points.
Click on the image to enlarge it.
Difficult for now to hypothesise a bearish trend reversal: however, a descent below 19,200 points would be dangerous as it could trigger a rapid correction and push prices towards the next graphic support placed in the 18,700-18,600 points area.
Click on the image to enlarge it.
The following ETFs can be used to invest in the Nifty 50 index (which contains the 50 most important Indian stocks):
Xtrackers Nifty 50, ISIN LU0292109690. It is an ETF that has assets under management of EUR 147 mln, which provides synthetic replication of the underlying (via swaps) and which adopts an accumulation policy (with dividends being reinvested within the fund). The total expense ratio (TER) is 0.85% per annum.
Franklin Ftse India 30/18, ISIN IE00BHZRQZ17. This is an ETF that replicates the performance of the Ftse India 30 index (an index that replicates the performance of large- to mid-capitalisation Indian companies, with the largest company in the index up to a maximum of 30 per cent of the index capitalisation and all other constituents up to a maximum of 18 per cent). The ETF, which has €322m in assets under management, provides for the physical replication of the underlying (through the purchase of the securities that make up the index) and adopts an accumulation policy (with dividends being reinvested within the fund). The total expense ratio (TER) is 0.19% per annum.
Amundi MSCI India, ISIN LU1681043086. It is an ETF that replicates the performance of the MSCI India index. The ETF has €127m in assets under management, provides for synthetic replication of the underlying (via a swap) and adopts an accumulation policy (with dividends being reinvested within the fund). The total expense ratio (TER) is 0.80% per annum.
Ishares MSCI India, ISIN IE00BZCQB185. It is an ETF that replicates the performance of the MSCI India index. The ETF has €2,147m in assets under management, provides for sampling replication (buying only the largest components of the index) and adopts an accumulation policy (with dividends being reinvested within the fund). The total expense ratio (TER) is 0.65% per annum.
Copyright DMF New Media – ETFWorld.co.uk
Reproduction prohibited in any form, even partial
Disclaimer
The contents of these notes and the opinions expressed should in no way be regarded as an invitation to invest. The analyses do not constitute a solicitation to buy or sell any financial instrument.The purpose of these notes is financial analysis and investment research. Where recommendations are made, they are of a general nature, are addressed to an indistinct audience and lack the element of personalisation. Although the result of extensive analysis, the information contained in these notes may contain errors. Under no circumstances can the authors be held liable for any choices made by readers on the basis of such erroneous information.erroneous information. Anyone deciding to carry out any financial transaction on the basis of the information contained in the site does so assuming full responsibility.
Subscribe to Our Newsletter